Appendix A — Statistics refresher
Below you find a brief overview over some relevant concepts in statistics that you should be familiar with from earlier modules.
A.1 Data and statistics as functions of data
Broadly, by “data” we refer to quantitative observations and measurements collected in experiments.
We denote the observed data by \(D =\{x_1, \ldots, x_n\}\) where \(n\) denotes the number of data points (the sample size). Each data point can be scalar or a multivariate quantity.
Generally, a statistic \(t(D)\) is function of the observed data \(D\). The statistic \(t(D)\) can be of any type and value (scalar, vector, matrix etc. — even a function). \(t(D)\) is called a summary statistic if it describes important aspects of the data such as location (e.g. the average \(\text{avg}(D) =\bar{x}\), the median) or scale (e.g. standard deviation, interquartile range).
A.2 Statistical learning
The aim in statistics, and by extension in data science and machine learning, is to use data to learn about and better understand the world. It is a key feature of statistics to employ probabilistic models for that purpose.
Let denote data models by \(p(x| \theta)\) where \(\theta\) represents the parameters of the model. Often (but not always) \(\theta\) can be interpreted as or is associated with some manifest property of the model. If there is only a single parameter we write \(\theta\) (scalar parameter). If we wish to highlight that there are multiple parameters we write \(\boldsymbol \theta\) (in bold type).
Specifically, our aim is to identify the best model(s) for the data in order to both
- explain the current data, and
- to enable good prediction of future data.
By choosing a sufficiently complex model the first aim (to explain the observed data) is often easily achieved. However, if the model is too complex it can fail to address the second aim (to predict unseen data well). Thus, when choosing a model we would like to avoid both the problem of underfitting (i.e. choosing an overly simplistic model) as well overfitting (i.e. choosing an overly complex model). Finding this balances will also help with interpreting the fitted model.
Typically, we focus the analysis to a specific model family with a some parameter \(\theta\).
An estimator for \(\theta\) is a function \(\hat{\theta}(D)\) of the data that maps the data (input) to an informed guess (output) about \(\theta\).
- A point estimator provides a single number for each parameter
- An interval estimator provides a set of possible values for each parameter.
Interval estimators can be linked to the concept of testing specified values for a parameter. Specifically a confidence interval contains all parameter values that are not significantly different from the best parameter.
A.3 Sampling properties of a point estimator
A point estimator \(\hat\theta\) depends on the data, hence it exhibits sampling variation, i.e. estimate will be different for a new set of observations.
Thus \(\hat\theta\) can be seen as a random variable, and its distribution is called sampling distribution (across different experiments).
Properties of this distribution can be used to evaluate how far the estimator deviates (on average across different experiments) from the true value:
\[\begin{align*} \begin{array}{rr} \text{Bias:}\\ \text{Variance:}\\ \text{Mean squared error:}\\ \\ \end{array} \begin{array}{rr} \operatorname{Bias}(\hat{\theta})\\ \operatorname{Var}(\hat{\theta})\\ \operatorname{MSE}(\hat{\theta})\\ \\ \end{array} \begin{array}{ll} =\operatorname{E}(\hat{\theta})-\theta\\ =\operatorname{E}\left((\hat{\theta}-\operatorname{E}(\hat{\theta}))^2\right)\\ =\operatorname{E}((\hat{\theta}-\theta)^2)\\ =\operatorname{Var}(\hat{\theta})+\operatorname{Bias}(\hat{\theta})^2\\ \end{array} \end{align*}\]
The last identity about MSE follows from \(\operatorname{E}(x^2)=\operatorname{Var}(x)+\operatorname{E}(x)^2\).
At first sight it seems desirable to focus on unbiased (for finite sample size \(n\)) estimators. However, requiring strict unbiasedness is not always a good idea. In many situations it is better to accept some bias in an estimator in order to achieve a smaller variance and an overall smaller MSE. This is called bias-variance tradeoff — as more bias is traded for smaller variance (or, conversely, less bias is traded for higher variance). This is also related to the above mentioned problems of underfitting (large bias) and overfitting (large variance).
A.4 Efficiency and consistency of an estimator
Typically, \(\operatorname{Bias}\), \(\operatorname{Var}\) and \(\operatorname{MSE}\) all decrease with increasing sample size so that with more data \(n \to \infty\) the errors become smaller and smaller.
Efficiency: An estimator \(\hat\theta_A\) is said to more efficient than estimator \(\hat\theta_B\) if for same sample size \(n\) it has smaller error (e.g. MSE) than the competing estimator.
The typical rate of decrease in variance of a good estimator is \(\frac{1}{n}\) and the rate of decrease in the standard deviation is \(\frac{1}{\sqrt{n}}\). Note that this implies that to get one digit more accuracy in an estimate (standard deviation decreasing by factor of 10) we need 100 times more data!
Consistency: \(\hat{\theta}\) is called consistent if \[ \operatorname{MSE}(\hat{\theta}) \longrightarrow 0 \text{ with $n\rightarrow \infty$ } \]
Consistency is an essential yet relatively weak requirement for any reasonable estimator. Among all consistent estimators we generally choose those that are most efficient, meaning that they exhibit the smallest variance and/or MSE for a given finite \(n\).
Consistency implies that, given an infinite amount of data, the true model can be accurately identified, provided that the model class includes the actual data-generating model. If the model class does not encompass the true model, strict consistency cannot be attained. Nevertheless, our goal remains to choose a model that is closest to the true model and approximates it as best as possible.
A.5 Empirical distribution
Suppose we observe data \(D=\{x_1, \ldots, x_n\}\) with each \(x_i \sim Q\) sampled independently and identically.
The empirical distribution based on data \(D\) can be written as the mixture \[ \hat{Q}_n = \frac{1}{n} \sum_{i=1}^n \delta(x_i) \] where \(\delta(\mu)\) is the delta distribution, a continuous distribution with mean \(\mu\) representing a point mass at \(\mu\). The “hat” is a reminder that \(\hat{Q}_n\) is a function of the observed data \(D\) with the subscript \(n\) indicating the sample size.
The corresponding empirical pdf is \[ \hat{q}_n(x) = \frac{1}{n} \sum_{i=1}^n \delta(x | x_i) \] This is a generalised function satisfying \(\hat{q}_n(x)=0\) for all \(x\neq x_i\) with infinite spikes at the data points \(x_i\) and still integrating to one.
The empirical cumulative distribution function (ecdf) is given by \[ \hat{Q}_n(x) = \frac{1}{n} \sum_{i=1}^n [x_i \leq x] \] where \([A]\) is the indicator function in Iverson bracket notation which equals 1 if \(A\) is true and 0 otherwise. Thus \(\hat{Q}_n(x)\) counts how many observations \(x_i \in D\) are smaller or equal than \(x\) and then standardises by the total number of samples \(n\). The empirical distribution function is monotonically nondecreasing from 0 to 1 in discrete steps.
The mean of the empirical distribution is the empirical mean and is given by the sample average: \[ \begin{split} \operatorname{E}_{\hat{Q}_n}(x) &= \operatorname{E}(\hat{Q}_n) \\ &= \frac{1}{n} \sum_{i=1}^n \operatorname{E}( \delta(x_i) )\\ &= \frac{1}{n} \sum_{i=1}^n x_i = \bar{x} \end{split} \]
In R the empirical distribution function is computed by ecdf().
A.6 Law of large numbers
The law of large numbers, discovered by Jacob Bernoulli (1655-1705), asserts that, if the mean exists, the sample average will converge to the mean as the sample size \(n\) becomes large, \[ \frac{1}{n} \sum_{i=1}^n x_i = \bar{x} \to \operatorname{E}(x) \] or equivalently, \[ \operatorname{E}(\hat{Q}_n) \to \operatorname{E}(Q) \] Therefore, when the mean is defined, it can be approximated by the empirical mean for sufficiently large values of \(n\).
A variant of the law of large numbers is that the empirical distribution \(\hat{Q}_n\) converges strongly (almost surely) to the underlying distribution \(Q\) as \(n \rightarrow \infty\): \[ \hat{Q}_n\overset{a. s.}{\to} Q \] The Glivenko-Cantelli theorem additionally asserts that the convergence is uniform.
As a result, with \(n \rightarrow \infty\) there’s also convergence of the average of a function of the observed samples to the corresponding expectation of the function of the random variable: \[ \operatorname{E}_{\hat{Q}_n}(h(x)) = \frac{1}{n} \sum_{i=1}^n h(x_i) \to \operatorname{E}_{Q}(h(x)) \]
Moreover, the law of large numbers provides a justification for interpreting large-sample limits of frequencies as probabilities. However, the converse assumption that all probabilities can be interpreted in frequentist manner does not follow from the law of large numbers or from the axioms of probability.
Finally, it is worth pointing out that the law of large number is only concerned with the asymptotic regime, finite sample behaviour (small \(n\)) can be quite different from the large-\(n\) case.
A.7 Empirical estimators
Thanks to the law of large numbers, we may use the empirical distribution \(\hat{Q}_n\) based on data \(D\) as a consistent estimator of the unknown true distribution \(Q\).
This motivates empirical estimators. If a quantity of interest \(\theta\) is a functional \(\theta = g(Q)\) of the true distribution \(Q\), its empirical estimator \(\hat{\theta}= g( \hat{Q}_n )\) is obtained by replacing the true distribution with the empirical distribution \(\hat{Q}_n\).
An example is the mean \(\operatorname{E}_Q(x)\) with regard to \(Q\). The empirical mean is the expectation with regard to the empirical distribution which equals the average of the samples: \[ \hat{\operatorname{E}}(x) = \hat{\mu} = \operatorname{E}_{\hat{Q}_n}(x) = \frac{1}{n} \sum_{i=1}^n x_i = \bar{x} \]
Similarly, other empirical estimators can be constructed simply by replacing the expectation in the definition of the quantity of interest by the sample average. For example, the empirical variance with unknown mean is given by \[ \widehat{\operatorname{Var}}(x) = \widehat{\sigma^2} = \operatorname{E}_{\hat{Q}_n}((x - \hat{\mu})^2) = \frac{1}{n} \sum_{i=1}^n (x_i - \bar{x})^2 \] Note the factor \(1/n\) before the summation sign. We can also write the empirical variance in terms of \(\overline{x^2} =\frac{1}{n}\sum^{n}_{k=1} x^2\) as \[ \widehat{\operatorname{Var}}(x) = \overline{x^2} - \bar{x}^2 \]
By construction, as a result of the strong convergence of \(\hat{Q}_n\) to \(Q\) empirical estimators are consistent, with their MSE, variance and bias all decreasing to zero with large sample size \(n\). However, for finite sample size they do have a finite variance and may also be biased.
For example, the empirical variance given above is biased with \(\operatorname{Bias}(\widehat{\sigma^2}) = -\sigma^2/n\). Note this bias decreases with \(n\). An unbiased estimator can be obtained by rescaling the empirical estimator by the factor \(n/(n-1)\): \[ \widehat{\sigma^2}_{\text{UB}} = \frac{1}{n-1} \sum_{i=1}^n (x_i -\bar{x})^2 \]
The empirical estimators for the mean and variance can also be obtained for random vectors \(\boldsymbol x\). In this case the data \(D = \{\boldsymbol x_1, \ldots, \boldsymbol x_n \}\) is comprised of \(n\) vector-valued observations.
For the mean get \[ \hat{\boldsymbol \mu} = \frac{1}{n}\sum^{n}_{k=1} \boldsymbol x_k = \bar{\boldsymbol x} \] and for the covariance \[\widehat{\boldsymbol \Sigma} = \frac{1}{n}\sum^{n}_{k=1} \left(\boldsymbol x_k-\bar{\boldsymbol x}\right) \; \left(\boldsymbol x_k-\bar{\boldsymbol x}\right)^T\] Note the factor \(\frac{1}{n}\) in the estimator of the covariance matrix.
With \(\overline{\boldsymbol x\boldsymbol x^T} = \frac{1}{n}\sum^{n}_{k=1} \boldsymbol x_k \boldsymbol x_k^T\) we can also write \[ \widehat{\boldsymbol \Sigma} = \overline{\boldsymbol x\boldsymbol x^T} - \bar{\boldsymbol x} \bar{\boldsymbol x}^T \]
A.8 Sampling distribution of mean and variance estimators for normal data
If the underlying distribution family of \(D = \{x_1, \ldots, x_n\}\) is known we can often obtain the exact distribution of an estimator.
For example, assuming normal distribution \(x_i \sim N(\mu, \sigma^2)\) we can derive the sampling distribution for the empirical mean and variance:
The empirical estimator of the mean parameter \(\mu\) is given by \(\hat{\mu} = \frac{1}{n} \sum_{i=1}^n x_i\). Under the normal assumption the distribution of \(\hat{\mu}\) is \[ \hat{\mu} \sim N\left(\mu, \frac{\sigma^2}{n}\right) \] Thus \(\operatorname{E}(\hat{\mu}) = \mu\) and \(\operatorname{Var}(\hat{\mu}) = \frac{\sigma^2}{n}\). The estimate \(\hat{\mu}\) is unbiased as \(\operatorname{E}(\hat{\mu})-\mu = 0\). The mean squared error of \(\hat{\mu}\) is \(\operatorname{MSE}(\hat{\mu}) = \frac{\sigma^2}{n}\).
The empirical variance \(\widehat{\sigma^2} = \frac{1}{n} \sum_{i=1}^n (x_i -\bar{x})^2\) for normal data follows a one-dimensional Wishart distribution \[ \widehat{\sigma^2} \sim \operatorname{Wis}\left(s^2 = \frac{\sigma^2}{n}, k=n-1\right) \] Thus, \(\operatorname{E}( \widehat{\sigma^2} ) = \frac{n-1}{n}\sigma^2\) and \(\operatorname{Var}( \widehat{\sigma^2}_{\text{ML}} ) = \frac{2(n-1)}{n^2}\sigma^4\). The estimate \(\widehat{\sigma^2}\) is biased since \(\operatorname{E}( \widehat{\sigma^2}_{\text{ML}} )-\sigma^2 = -\frac{1}{n}\sigma^2\). The mean squared error is \(\operatorname{MSE}( \widehat{\sigma^2}) = \frac{2(n-1)}{n^2}\sigma^4 +\frac{1}{n^2}\sigma^4 =\frac{2 n-1}{n^2}\sigma^4\).
The unbiased variance estimate \(\widehat{\sigma^2}_{\text{UB}} = \frac{1}{n-1} \sum_{i=1}^n (x_i -\bar{x})^2\) for normal data follows a one-dimensional Wishart distribution \[ \widehat{\sigma^2}_{\text{UB}} \sim \operatorname{Wis}\left(s^2 = \frac{\sigma^2}{n-1}, k = n-1 \right) \] Thus, \(\operatorname{E}( \widehat{\sigma^2}_{\text{UB}} ) = \sigma^2\) and \(\operatorname{Var}( \widehat{\sigma^2}_{\text{UB}} ) = \frac{2}{n-1}\sigma^4\). The estimate \(\widehat{\sigma^2}_{\text{ML}}\) is unbiased since \(\operatorname{E}( \widehat{\sigma^2}_{\text{UB}} )-\sigma^2 =0\). The mean squared error is \(\operatorname{MSE}( \widehat{\sigma^2}_{\text{UB}} ) =\frac{2}{n-1}\sigma^4\).
Interestingly, for any \(n>1\) we find that \(\operatorname{Var}\left( \widehat{\sigma^2}_{\text{UB}} \right) > \operatorname{Var}\left( \widehat{\sigma^2}_{\text{ML}} \right)\) and \(\operatorname{MSE}\left( \widehat{\sigma^2}_{\text{UB}} \right) > \operatorname{MSE}\left( \widehat{\sigma^2}_{\text{ML}} \right)\) so that the biased empirical estimator has both lower variance and lower mean squared error than the unbiased estimator.
A.9 \(t\)-statistics
One sample \(t\)-statistic
Suppose we observe \(n\) independent data points \(x_1, \ldots, x_n \sim N(\mu, \sigma^2)\). Then the average \(\bar{x} = \sum_{i=1}^n x_i\) is distributed as \(\bar{x} \sim N(\mu, \sigma^2/n)\) and correspondingly \[ z = \frac{\bar{x}-\mu}{\sqrt{\sigma^2/n}} \sim N(0, 1) \]
Note that \(z\) uses the known variance \(\sigma^2\).
If the variance is unknown and is estimated by the unbiased variance
\[
s^2_{\text{UB}} = \frac{1}{n-1} \sum_{i=1}^n (x_i -\bar{x})^2
\] then one arrives at the one sample \(t\)-statistic \[
t_{\text{UB}} = \frac{\bar{x}-\mu}{\sqrt{s^2_{\text{UB}}/n}} \sim t_{n-1} \,.
\] It is distributed according to a Student’s \(t\)-distribution with \(n-1\) degrees of freedom, with mean 0 for \(n>2\) and variance \((n-1)/(n-3)\) for \(n>3\).
If instead of the unbiased estimate the empirical variance (i.e. the maximum likelihood estimate, ML) \[ s^2_{\text{ML}} = \frac{1}{n} \sum_{i=1}^n (x_i -\bar{x})^2 = \frac{n-1}{n} s^2_{\text{UB}} \] is used then this leads to a slightly different statistic \[ t_{\text{ML}} = \frac{\bar{x}-\mu}{ \sqrt{ s^2_{\text{ML}}/n}} = \sqrt{\frac{n}{n-1}} t_{\text{UB}} \] with \[ t_{\text{ML}} \sim t_{n-1}\left(0, \tau^2=\frac{n}{n-1}\right) \] Thus, \(t_{\text{ML}}\) follows a location-scale \(t\)-distribution, with mean 0 for \(n>2\) and variance \(n/(n-3)\) for \(n>3\).
Two sample \(t\)-statistic with common variance
Now suppose we observe normal data \(D = \{x_1, \ldots, x_n\}\) from two groups with sample size \(n_1\) and \(n_2\) (and \(n=n_1+n_2\)) with two different means \(\mu_1\) and \(\mu_2\) and common variance \(\sigma^2\): \[x_1,\dots,x_{n_1} \sim N(\mu_1, \sigma^2)\] and \[x_{n_1+1},\dots,x_{n} \sim N(\mu_2, \sigma^2)\] Then \(\hat{\mu}_1 = \frac{1}{n_1}\sum^{n_1}_{i=1}x_i\) and \(\hat{\mu}_2 = \frac{1}{n_2}\sum^{n}_{i=n_1+1}x_i\) are the sample averages within each group.
The common variance \(\sigma^2\) may be estimated either by the unbiased estimate \[
s^2_{\text{UB}} = \frac{1}{n-2} \left(\sum^{n_1}_{i=1}(x_i-\hat{\mu}_1)^2+
\sum^n_{i=n_1+1}(x_i-\hat{\mu}_2)^2\right)
\] (note the factor \(n-2\)) or by the empirical estimate (ML)
\[
s^2_{\text{ML}} = \frac{1}{n} \left(\sum^{n_1}_{i=1}(x_i-\hat{\mu}_1)^2+\sum^n_{i=n_1+1}(x_i-\hat{\mu}_2)^2\right) =\frac{n-2}{n} s^2_{\text{UB}}
\] The estimator for the common variance is a often referred to as pooled variance estimate as information is pooled from two groups to obtain the estimate.
Using the unbiased pooled variance estimate the two sample \(t\)-statistic is given by \[ t_{\text{UB}} = \frac{\hat{\mu}_1-\hat{\mu}_2}{ \sqrt{ \left(\frac{1}{n_1}+\frac{1}{n_2}\right) s^2_{\text{UB}}} } = \frac{\hat{\mu}_1-\hat{\mu}_2}{ \sqrt{ \left(\frac{n}{n_1 n_2} \right) s^2_{\text{UB}} } } \] In terms of empirical frequencies \(\hat{\pi}_1 = \frac{n_1}{n}\) and \(\hat{\pi}_2 = \frac{n_2}{n}\) it can also be written as \[ t_{\text{UB}} = \sqrt{n} \frac{\hat{\mu}_1-\hat{\mu}_2}{ \sqrt{ \left(\frac{1}{\hat{\pi}_1}+\frac{1}{\hat{\pi}_2}\right) s^2_{\text{UB}} }} = \sqrt{n\hat{\pi}_1 \hat{\pi}_2} \frac{\hat{\mu}_1-\hat{\mu}_2}{ \sqrt{ s^2_{\text{UB}}}} \] The two sample \(t\)-statistic is distributed as \[ t_{\text{UB}} \sim t_{n-2} \] i.e. according to a Student’s \(t\)-distribution with \(n-2\) degrees of freedom, with mean 0 for \(n>3\) and variance \((n-2)/(n-4)\) for \(n>4\). Large values of the two sample \(t\)-statistic indicates that there are indeed two groups rather than just one.
The two sample \(t\)-statistic using the empirical (ML) pooled estimate of the variance is \[ \begin{split} t_{\text{ML}} & = \frac{\hat{\mu}_1-\hat{\mu}_2}{ \sqrt{ \left(\frac{1}{n_1}+\frac{1}{n_2}\right) s^2_{\text{ML}} } } = \frac{\hat{\mu}_1-\hat{\mu}_2}{ \sqrt{ \left(\frac{n}{n_1 n_2}\right) s^2_{\text{ML}} } }\\ & =\sqrt{n} \frac{\hat{\mu}_1-\hat{\mu}_2}{ \sqrt{ \left(\frac{1}{\hat{\pi}_1}+\frac{1}{\hat{\pi}_2}\right) s^2_{\text{ML}} }} = \sqrt{n \hat{\pi}_1 \hat{\pi}_2 } \frac{\hat{\mu}_1-\hat{\mu}_2}{ \sqrt{ s^2_{\text{ML}}}}\\ & = \sqrt{\frac{n}{n-2}} t_{\text{UB}} \end{split} \] with \[ t_{\text{ML}} \sim t_{n-2}\left(0, \tau^2=\frac{n}{n-2}\right) \] Thus, \(t_{\text{ML}}\) follows a location-scale \(t\)-distribution, with mean 0 for \(n>3\) and variance \(n/(n-4)\) for \(n>4\).
A.10 Confidence intervals
General concept
A confidence interval (CI) is an interval estimate \(\widehat{\operatorname{CI}}(x_1, \ldots, x_n)\) that depends on data and has a random (sampling) variation as well as a frequentist interpretation.
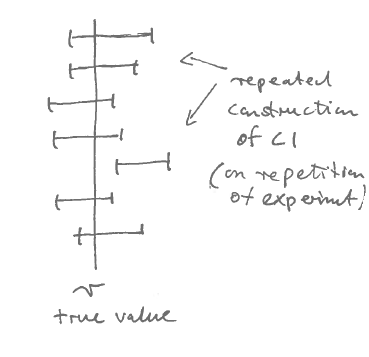
A key property of a confidence interval is its coverage probability \[ \kappa = \operatorname{Pr}( \theta \in \widehat{\operatorname{CI}}) \] which describes how often — in repeated identical experiments — the estimated confidence interval overlaps the true parameter value \(\theta\), i.e. how often it will “cover” \(\theta\) (see Figure A.1). In the above \(\theta\) is fixed and \(\widehat{\operatorname{CI}}\) is random. Note that \(\kappa\) is explicitly not the probability that the true value is contained in a specific instance of an estimated confidence interval. Specifically, any particular confidence interval either covers \(\theta\) or it doesn’t.
For example, a coverage probability \(\kappa=0.95\) (95%) implies that in 95 out of 100 repeated experiments the corresponding estimated confidence interval will contain the (unknown) true value.
It is trivial to create a confidence with high coverage, simply by assuming a wide interval. Therefore, a useful confidence interval must be both compact and have high coverage.
Finally, there is also a direct relationship between confidence intervals and statistical testing procedures. Specifically, a confidence interval can be interpreted as the set of parameter values that cannot be rejected. The complement \(\alpha=1-\kappa\) is called the rejection probability or significance level.
Symmetric normal confidence interval
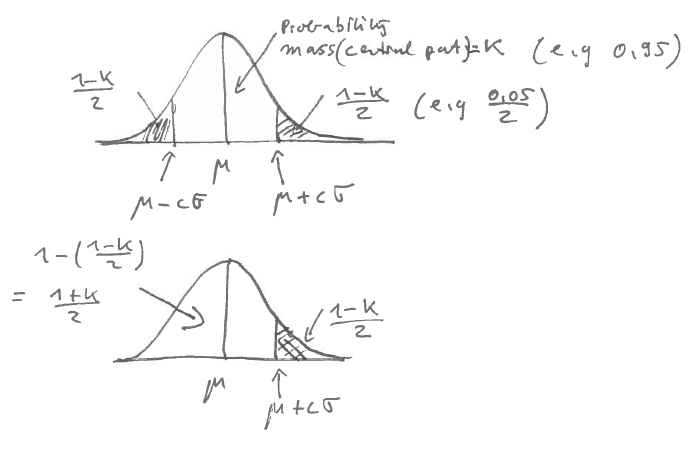
For a normally distributed univariate random variable it is straightforward to construct a symmetric two-sided confidence interval with a given desired coverage \(\kappa\) (Figure A.2). The confidence interval corresponds to the central part of the density and contains probability mass \(\kappa = 1-\alpha\) whereas both tails each contain mass \((1-\kappa)/2 = \alpha/2\) and correspond together to the rejection region.
A symmetric normal confidence interval with nominal coverage \(\kappa\) for
- a scalar parameter \(\theta\)
- with normally distributed estimate \(\hat{\theta} \sim N(\theta, \sigma^2)\)
is given by \[ \widehat{\operatorname{CI}}=[\hat{\theta} \pm c \sigma] \] where the critical value \(c\) is chosen to achieve the desired coverage probability \[ \kappa = \operatorname{Pr}(\hat{\theta} - c \sigma \leq \theta \leq \hat{\theta} + c \sigma) \] The critical value \(c\) is obtained as the \((1+\kappa)/2 = 1- \alpha/2\) quantile \(z_{(1+\kappa)/2} = z_{1- \alpha/2}\) of the standard normal distribution \(N(0,1)\) so that \[ c=\Phi^{-1}\left(\frac{1+\kappa}{2}\right) = \Phi^{-1}\left(1- \frac{\alpha}{2}\right) \] where where \(\Phi(c)\) is the cumulative distribution function (CDF) of the standard normal \(N(0,1)\) distribution. Its inverse \(\Phi^{-1}\) is the standard normal quantile function.
| Coverage \(\kappa\) | Critical value \(c\) | Quantile \(z_{(1+\kappa)/2}\) |
|---|---|---|
| 0.90 | 1.6449 | \(z_{0.95}\) |
| 0.95 | 1.9600 | \(z_{0.975}\) |
| 0.99 | 2.5758 | \(z_{0.995}\) |
Table A.1 lists the critical values \(c\) for the three most commonly used values of \(\kappa\). It is useful to memorise these values as they are used frequently.
One-sided confidence interval based on the chi-squared distribution

For a chi-squared distributed statistic commonly a one-sided confidence interval of the form \([0, c ]\) is used with nominal coverage probability \(\kappa = \operatorname{Pr}(x \leq c)\) (see Figure A.3). The right tail contains \(1-\kappa = \alpha\) probability mass.
We obtain the critical value \(c\) as the \(\kappa=1-\alpha\) quantile of the chi-squared distribution by using the quantile function, i.e. by inverting the CDF of the chi-squared distribution.
| Coverage \(\kappa\) | Critical value \(c\) | Quantile \(x_{\kappa}\) |
|---|---|---|
| 0.90 | 2.7055 | \(x_{.90}\) |
| 0.95 | 3.8415 | \(x_{.95}\) |
| 0.99 | 6.6349 | \(x_{.99}\) |
Table A.2 lists the critical values for the three most common choices of the coverage probability \(\kappa\) for a chi-squared distribution with one degree of freedom. Note that these critical values are the squared values of the corresponding thresholds in Table A.1 (with small discrepancies due to rounding).